Monthly warning
Instead of absolute values, the maps of 1-6 months forecasts thus show probabilities for river flow in three categories: above normal, near normal and below normal.
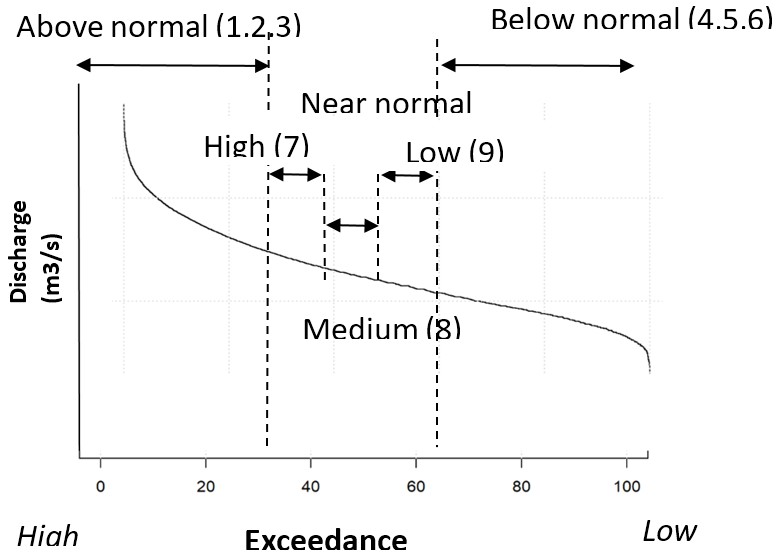
| ABOVE NORMAL (ABOVE 33TH PROBABILITIES) |
BELOW NORMAL (BELOW 66TH PROBABILITIES) |
NEAR NORMAL (BETWEEN 33TH AND 66TH PROBABILITIES) |
|---|---|---|
| 1: High > 75% compared to near normal (NN) | 2: Medium 50-75% compared to NN | 3: Low < 50% compared to NN |
| 4: High <-75% compared to NN | 5: Medium -75% | 6: Low >-50% compared to NN |
|
| 7: Between 33th and 46th probabilities | 8: Between 46th and 56th probabilities | 9: Between 56th and 66th probabilities |